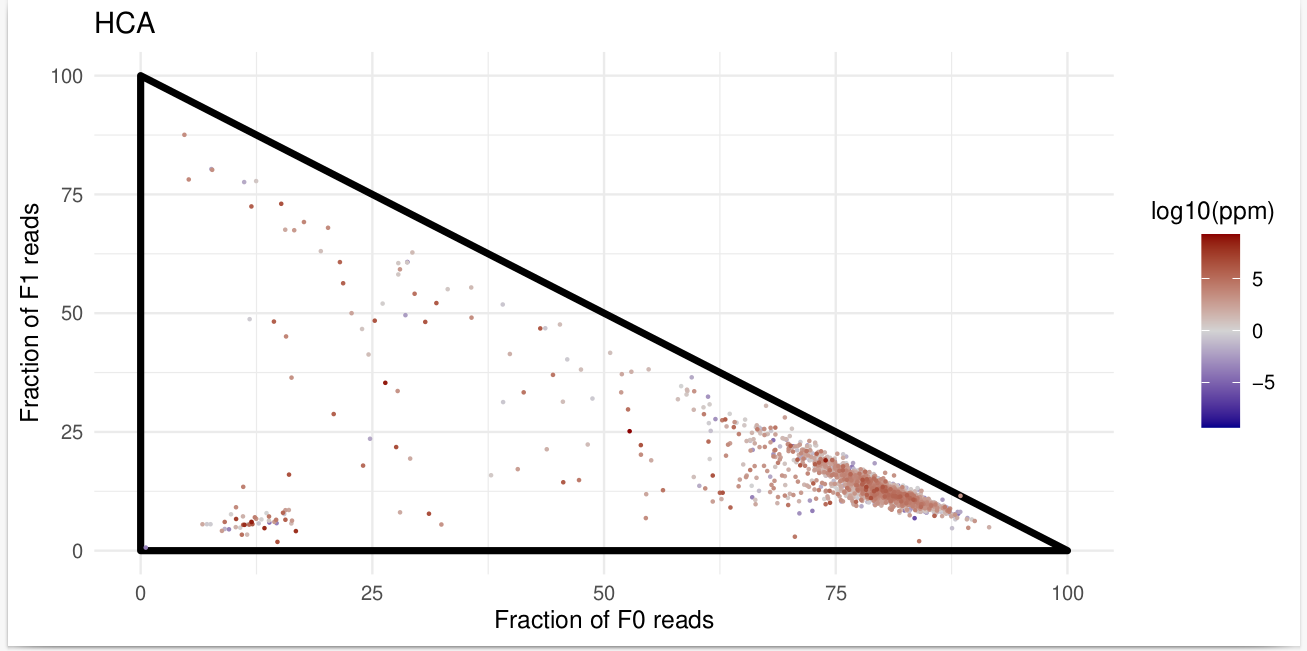
Triangle Plot for Ribosome Profiling Data#
Overview#
This script is an additional tool for ORFribo located in the Extra_Scripts directory on Github. It visualizes periodicity and translation efficiency in ribosome profiling data.
It generates a triangle plot that helps analyze in-frame and out-of-frame ribosome occupancy across coding sequences (CDS).
Installation & Dependencies#
The script automatically checks for and installs missing dependencies. If you want to ensure all required packages are installed manually, run:
install.packages(c("ggplot2", "ggbeeswarm", "ggpubr", "plotrix", "RColorBrewer", "ineq",
                    "ggExtra", "ggridges", "proxy", "dplyr", "seqinr", "stringr"),
                 repos = "http://cran.rstudio.com/")
Usage#
1. Running the Script#
To execute the script from the command line:
Rscript triangle_plot.R input_data.csv output_plot.pdf feature_column blue grey red
Parameters:
input_data.csv: Path to the input CSV file.
output_plot.pdf: Path to the output PDF file.
blue grey red : (Optional) Colors for low, mid, and high intensity.
2. Example :#
Rscript triangle_plot.R data.csv output.pdf HCA "darkblue" "lightgrey" "darkred"
